Visualizing Historic Settlements of Paris from Prehistory to Today
Purpose: To create a methodology for "Mapping History Underfoot," exploring the remnants of the ancient and medieval settlements of Paris through open data, spatial data analysis, and information design tools. While none of the data used and analyzed is novel (in fact it's been analyzed already in various ways by others), this methodology should demonstrate a role that cultural institutions and data analysts can take on together in making the past relevant today through new technologies.
Research Goal: Create a digital humanities project that maps the history of Paris' settlement from prehistory to today, using archaeological data, historic maps, and GIS technology.
Results: This project led to multiple deliverables for two classes in spring 2023: a Final Static Map Exhibit poster for my Visual Communication & Information Design class, and a StoryMap that incorporated Interactive and Static Maps plus a final Methodology & Findings guide for my Intro to GIS class. I exhibited both products at InfoShow 2023.
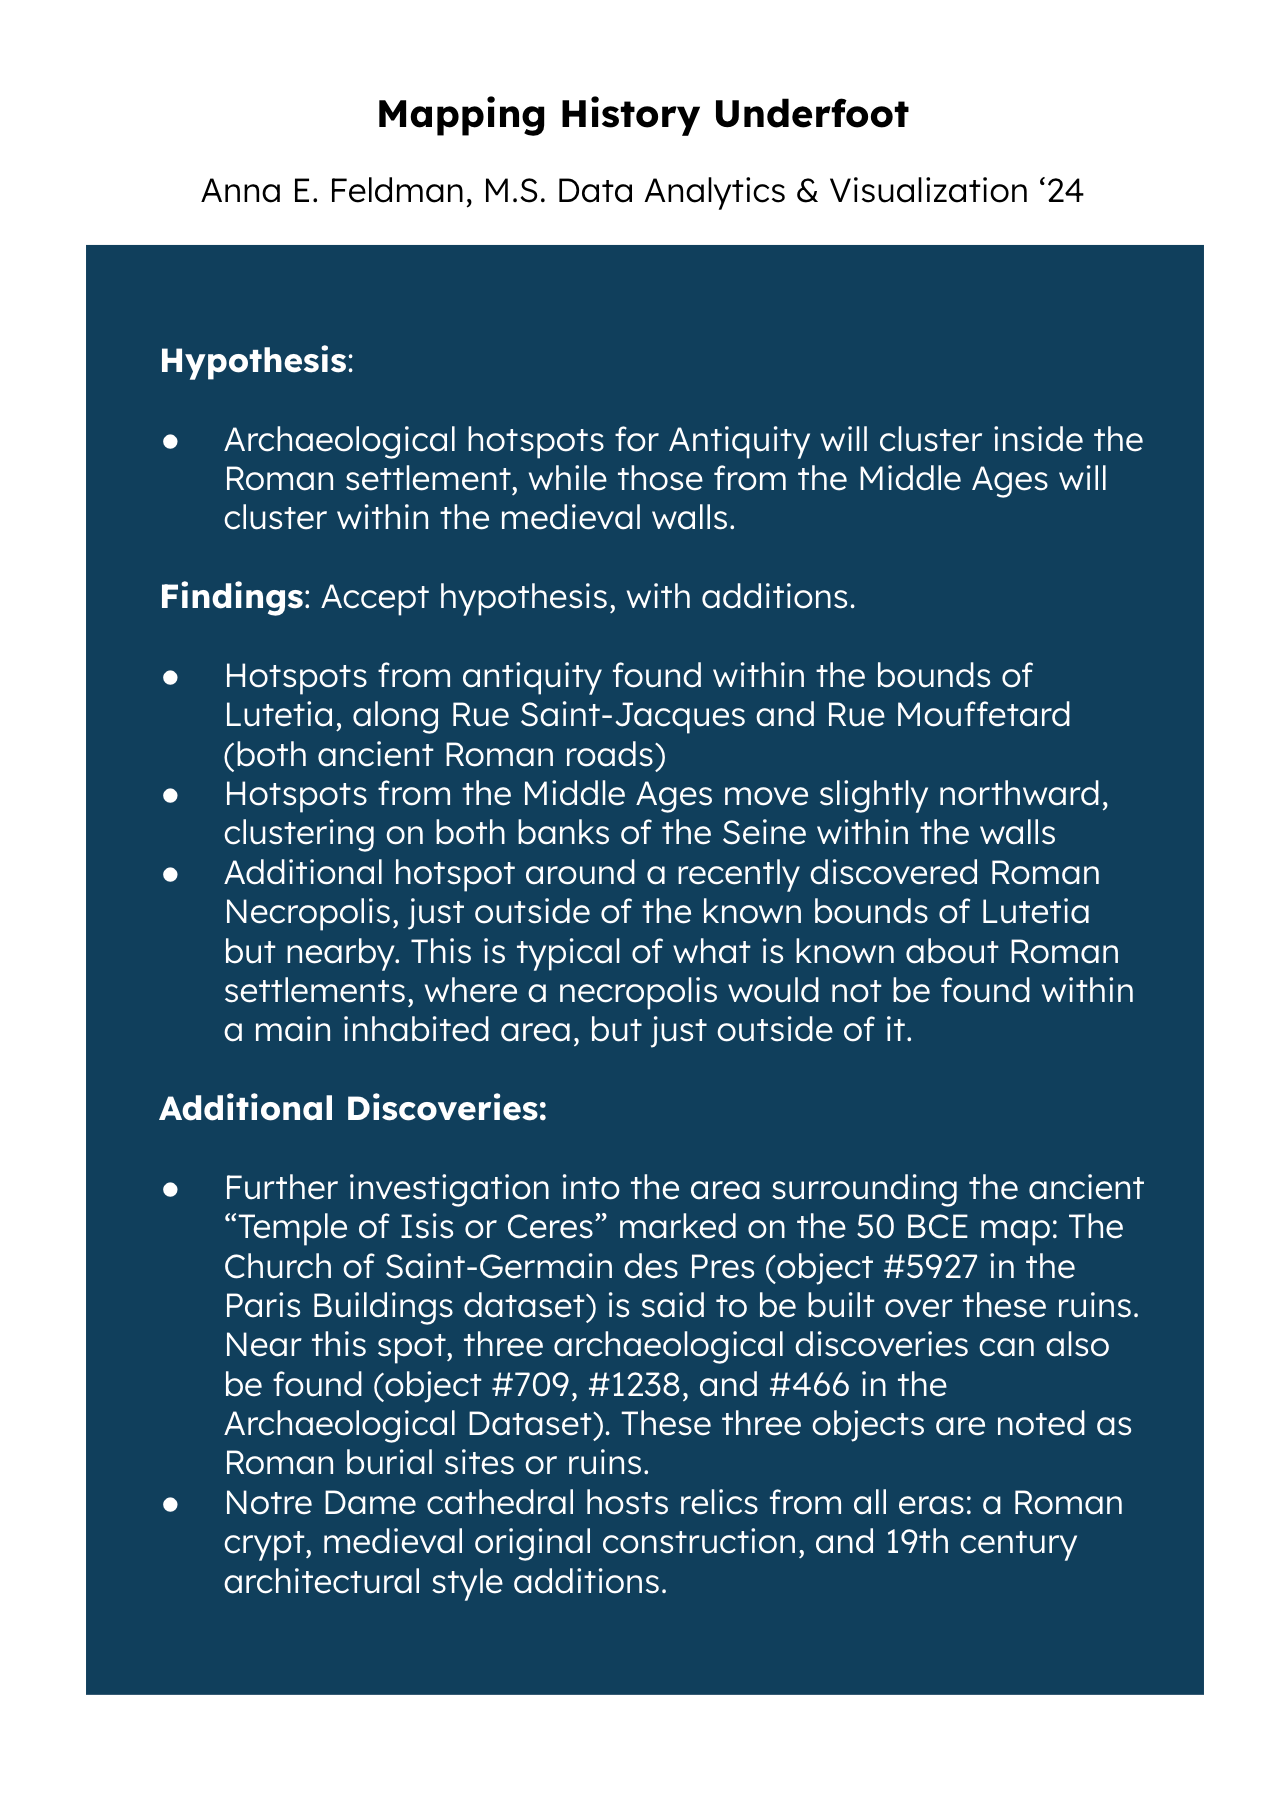
Both projects showcased the results of running spatial statistics on archaeological findings within the city, layered over georeferenced historical maps of earlier Parisian settlements. My hypothesis was that archaeological hotspots labeled "Antiquity" would cluster inside the bounds of the old Roman settlement, while those labeled "Middle Ages" would cluster within the medieval walls. I ended up accepting these hypotheses, with additions. More on these findings and the additional discoveries that the analysis yielded can be found in the final projects below.
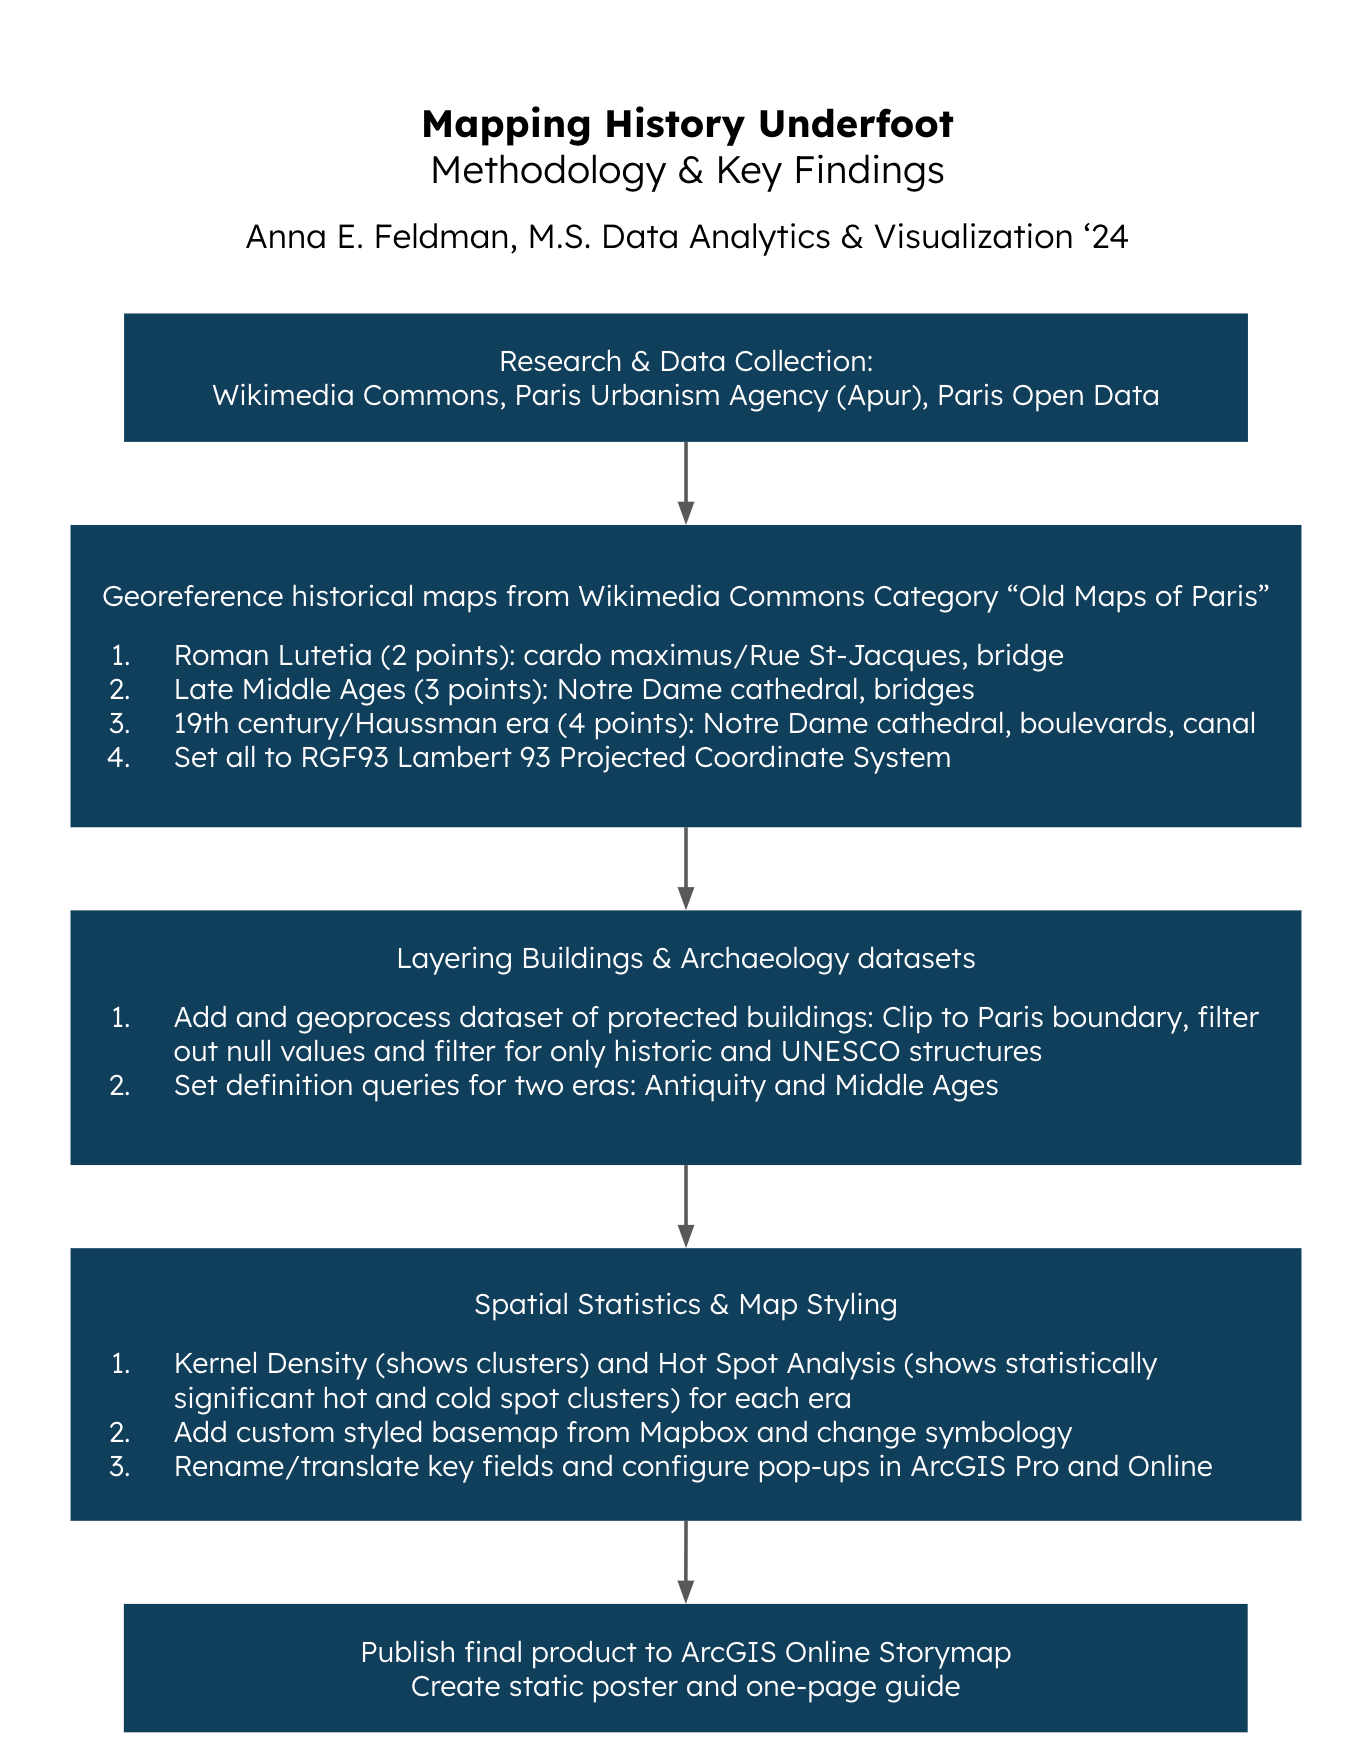
Methodology & Tools: Data collection (Open Data France/Paris, Wikimedia Commons); Spatial data analysis and statistics: Georeferencing, Geocoding, Geoprocessing, Hot Spot Analysis, and Kernel Density Analysis; Map design; Storymap creation
Tools Used: Python, ArcGIS Pro & ArcGIS Online, Mapbox Basemaps
Skills: End-to-end data project, Information design, Data storytelling, Spatial data analysis, Explanatory post
Learning Outcomes: Communication, Technology, Research, Critical Perspectives
Static Map Exhibit:
I create this final poster exhibit for Visual Communication & Information Design, and eventually for Info Show, using the results of the spatial analyses I produced in Intro to GIS class. This was an opportunity for me to implement principles of visual design, typography, and color theory that I learned in class to some complex data processing and analysis work.
StoryMap with Interactive Webmaps:
The StoryMap I produced for Intro to GIS details how I used spatial analysis tools alongside georeferenced historical maps to create a methodology and a final resource that could be used by educators, historians, policymakers, preservationists, and more. The methodology shows how using open data and GIS tools can illuminate the ancient and medieval history of a modern day city and visualize the changes that eventually created the modern Paris. Paris in particular is a model city for this type of analysis, thanks to their extensive efforts to publish open datasets via cultural and governmental organizations.
One-Page Guide to Methodology & Findings
I created the handout below to accompany the project and as a guide for attendees of the Info Show exhibit. This is a front-and-back handout with a methodology walkthrough and an overview of the project's findings.


Sources
POP, la plateforme ouverte du patrimoine
Esri (ArcGIS): GIS Dictionary
Roman & Medieval Paris Research: Musee de Cluny
Images: Chronological Old Maps of Paris (Wikimedia Commons)